![[keith-snook.info]](/stuff/keith-info-S.png)
~ Amplifier–Buffer PCB ~ ECC81–83 Graphs ~
Here is an enlarged section from the Mullard characteristic curve for an ECC81 taken from my BBC Wood Norton [Happy Days] training notes to support the Valve Amplifier/Buffer article ~ During the BBC transmission engineering courses we used these curves to calculate a.c. gains and d.c. operating points for various valve amplifier designs but not at currents as low as 1mA or anode voltages as low as 40V even with the sharpest pencil

Click image to see complete curve
There are 3 basic parameters that describe a Thermionic Valve ~ They can be read directly from or calculated from the manufacturers characteristic curves ~ In each case the parameter is calculated using 2 values while holding a third value fixed and this 3 dimensional approach to characterisation can be misleading unless you accept that in a practical amplifier the 'fixed' value will change and modify the parameter you used to make a calculation
µ ~ Is known as the amplification factor ~ It is the maximum gain a valve can achieve at a particular fixed anode current which in practice means using a constant current anode load and not loading the output ~ so a high input impedance follower may be required ~ The gain of the stage will vary with heater voltage and valve condition so some form of feedback will be required making a practical amplifier based on gain indicated by µ is impractical
From the graph above µ is calculated by measuring Va between the points where the line Ia =1.1mA crosses the curves for Vg =0V and Vg ≈1V to give µ =∆Va/∆Vg ~ this way µ gets calculated at 46 which I believe is lower than it actually is at this operating point ~ µ becomes greater as Va lowers ~ For 1.1mA at Va =200V µ =45 at Va =170V µ =49 and at Va =100V µ =52 ~ see other ECC81 curves below
gm ~ Is known as the Mutual Conductance and is a measure of how much current a Valve will conduct for a given change in control voltage on one of its grids ~ Following the rules the parameter is determined with the anode and other grid voltages held constant so the maximum 'effect' of gm can only be appreciated with a 0Ω or current mirror load or in practical amplifiers a transformer or inductor load
From the graph above gm is derived by measuring Ia where the line 40V crosses the curves for Vg =0V and Vg ≈1V to give gm =∆Ia/∆Vg (mA/V) ~ As you can see from the above curves the gm at Va =40V looks about 2.6mA for a 1V change in Vg but it is not 2.6mA/V in the region of the operating point due to the asymmetric ~ distortion producing ~ spread along the curve
ra ~ Is known as the Anode Slope Resistance or the effective output resistance of a valve ~ It appears as a resistance in series with a voltage source inside the valve or across a current source inside the valve depending on the model used ~ ra is measured with the grid voltages held constant and may appear of no use until you want to make a perfect current sink or output dependant distortion becomes a problem
From the graph above ra is µ/gm =∆Va/∆Vg/∆Ia/∆Vg where the two ∆Vg cancel and ra =∆Va/∆Ia ~ But the values for µ and gm derived from the curve above ~ around the point Va =40V are not the most accurate ~ When trying to measure how an ECC81 and other valves performed in the Amplifier/Buffer circuit at low Va and Ia I found myself plotting my own curves using a Tektronix 576 Curve Tracer [see below]
The complex interdependencies changing internal gains and impedances within a triode amplifier as Va Ia and Vg change dynamically cause all kinds of distortion and colouration ~ Simply isolating one cause of distortion such as the non linearity of the Ia/Vg transfer function cannot fully explain the differences between the sound of similar or even the same type of valves
Some valve manufacturers publish other 'typical' curves that plot Vg ra gm and µ against Ia for a given Va and these can be very useful working at low Ia but if the characteristics do not cover the Va you are operating at then interpolation or guesswork is again required
It is likely that ra is not measured independently and like the other parameters the results are adjusted to produce smooth regular curves ~ It should also be obvious when looking at valve characteristic curves that the specifications published for many valve amplifier 'designs' are also just 'typical' although many sound better than the design would suggest

Mullard ECC81 parameters µ gm ra Vg plotted at Va= 100V
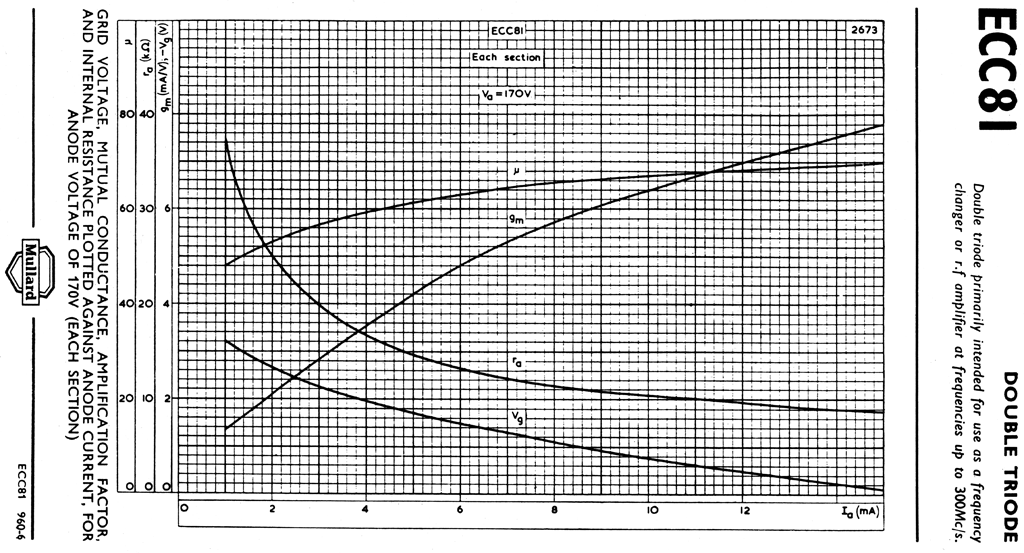
Mullard ECC81 parameters µ gm ra Vg plotted at Va= 170V
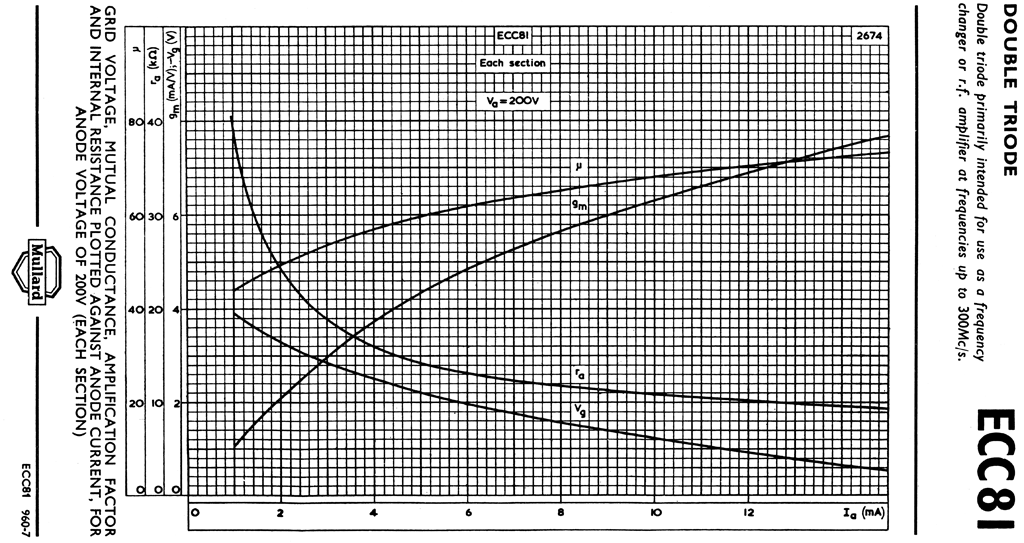
Mullard ECC81 parameters µ gm ra Vg plotted at Va= 200V

Mullard ECC81 parameters µ gm ra Vg plotted at Va= 250V
~ Plotting Characteristic curves using Tektronix 576 Curve Tracer ~
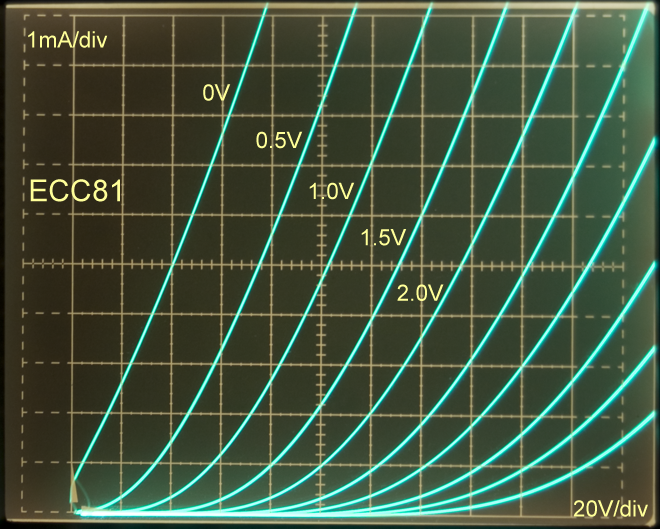
The picture on the left is a screen shot from my TEK–576 Curve Tracer showing the origin of an ECC81 characteristic curve plot
The steps –Vg relative to cathode could be made closer together and although only a maximum of 10 uniformly spaced steps are available using the 576 they can be offset up to ±10x the step voltage so more accurate measurements close to an operating point could be made
With an expanded scale and 0.5V steps in –Vg this area of the curves now looks more linear than the Mullard curves shown at the top of this page but the parameters µ gm and ra still vary greatly across this reduced area and It should be clear that a slight deviation from an optimum operating point will give less than optimum results and the distortion will change with signal level and d.c. conditions and changes in the heater voltage
 This screen shot is the same ECC81 as above but now with a 27kΩ resistor in the cathode
As I mention in the Valve amplifier/buffer and LEAK amplifier gain reduction articles the modified gm' of a valve with an un–bypassed cathode resistor Rk is reduced to about 1/Rk which in this case is about 35µA/V depending on the gm of the valve
![]() The anode voltage Va sweeps to 200V as before but the anode current Ia range is now only 1mA and the –Vg steps are 2V with each step increasing Ia by about 70µA consistent with a gm' of 35µA/V ~ Anode current does not start to flow until Va >
–Vg as seen
The anode voltage Va sweeps to 200V as before but the anode current Ia range is now only 1mA and the –Vg steps are 2V with each step increasing Ia by about 70µA consistent with a gm' of 35µA/V ~ Anode current does not start to flow until Va >
–Vg as seen
The curve looked like a flat line at the bottom of the display until the x scale was made 100µA/div but even then did not look suitable for use as an amplifier because in practice the 27kΩ resistor 'self biased' the valve to almost 'cut off' unless the grid is raised +ve ~ Using the TEK–576 the effect of the grid being made +ve can be simulated using the step offset control which can be set to a maximum of ±10x the step voltage ~ here the steps are 2V allowing a +20V offset
This characteristic looks more like a pentode or even a transistor due to the increase in ra to >1.2MΩ ~ The ∆Ia between Vg steps is very linear and additional steps above and below those shown will run virtually parallel making interpolation and parameter measurements very easy ~ A load line can be drawn on the curve referenced from 0V as Rk is now part of the active device
The load–line for an anode load of 100kΩ [used in the Amplifier/Buffer article] and a 180V supply is drawn onto the curve in the usual way between the points Ia =0V when Va =180V and Va =0V when Ia =180V/100kΩ =1.8mA ~ Unlike normal triode curves the position of the load–line along the Va axis is not so critical for a.c. amplification due to the regular spacing and slope of the Vg steps
Using this [used old] ECC81 the amplifier gain calculated where the load-line crosses Vg=2V and Vg=20V is about Va =58V/Vg =18V giving a gain of 3.22x [100kΩ/27kΩ =3.7x] ~ Due to the regular spacing of the Vg steps the operating point can be positioned almost anywhere along the load–line without a change of gain so an optimum point can be
An un-bypassed cathode resistor has such a significant effect on the gm of a triode that in the 10dB [3.16x] version of the amplifier/Buffer even an old ECC81 that had failed AVO testing with 20% gm gave good results
 Changing the ECC81 for an ECC82 which for the same operating conditions normally has lower gm ra and µ gives an amplifier gain of 9dB ~ If this substitute were done in a traditional design the results would be . . .
From the ECC82 curves with Rk =27kΩ shown on the left the gm is again about 35µA/V but the slope of the Vg steps is steeper because ra has only been increased to ra'≈ 460kΩ ~ The gain calculated from the load–line is Va =52V/Vg =18V =2.89x or 9.2dB which correlates well with gmxRa' and measured the results
 Changing the ECC81 for an ECC83 which tends to have more than twice the ra and µ but a lower gm [and apparently is designed to work at low Ia] the amplifier gain is now 11dB ~ As before if this substitute were done in a traditional design the results would be unpredictable
From the ECC83 curves with Rk =27kΩ shown on the right the gm is once again about 35µA/V but the slope of the Vg steps is less because ra has been increased to ra' ≈2.8MΩ
The gain calculated from the load–line is about Va =64V/Vg =18V =3.55x or 11dB which correlates with the measured results and those of my un—bypassed Rk calculator
The Amplifier/Buffer project was not specifically 'designed' for an ECC83 or an ECC82 ~ The chosen operating point for the available HT of 180V and gain of 10dB was for an ECC81 which I tend to use a lot
As shown above an un–bypassed high value cathode resistor tends to lower but also 'normalise' the gm and increase the ra of the gain stage triode so we get predictable gain and operating point for a wide variety of different triode types simply plugged into the same circuit
Local negative feedback across a Rk of 27kΩ reduces the distortion from this simple amplifier and allows higher than normal input voltage before input overload ~ The gain is predictable and the reduction of capacitors in the signal path should make for a 'better sounding' gain stage
As the value of Rk is reduced the gain increases as does distortion until a point is reached where Rk [still un–bypassed] becomes the value of an auto bias resistor and any further reduction would require a negative grid supply or a bypass capacitor to increase gain and the ability to simply swap valve types would be lost
Using an ECC81 auto biased for a gain stage Ia ≈ 1mA due to Rk=1.8kΩ with RL=100k a gain of 27dB with low distortion is possible but not as predictable as when set for lower gains with higher local feedback due to higher values of Rk ~ Whether auto bias or higher values of Rk are used a cathode follower buffer ensures the gain is not affected by loading

Manufacturers like Mullard RCA and Brimar published curves of Vg ra gm and µ against Ia [like those shown here and above] in addition to the more common Ia/Va characteristics but only for limited values of Va and I suspect with ra calculated rather than measured
The Mullard curves for the ECC83 were only supplied for Va=100V and Va=250 and this along with published application circuits led to many similar [me too] ECC83 based 'designs' which could have been better optimised with a little effort and by investigating other operating conditions around a lower Va
Using a valve tester like the AVO163 gm can be measured reasonably accurately and directly while monitoring Ia at low Va [provided the meters have been modified to read correctly or external meters are used] but either µ or ra also need to be determined by some other means

With a valve tester or a Curve Tracer ra can be determined from ra = ∆Va/∆Ia by switching the anode voltage steps but at low Va ra is often 10s of kΩ and determining the small change in Ia [due to a change in Va alone] may be difficult
My un—bypassed Rk calculator does not use gm to determine its results but does calculate µ from entered values for gm and ra ~ By using all 3 values taken from valve characteristics or measurements a check that µ = gm x ra should be made to confirm the values
If you have read this far and have been looking at the graphs of Vg ra gm and µ against Ia you may notice that these curves change more at low Ia which leads some to use higher Ia in an attempt to get lower distortion but good circuits like the QUAD 22 prove that high Ia is not always required

Sometimes you may see these Vg ra gm and µ against Ia curves for low Va voltages like 50V or even lower when the valve is intended for use in portable or car radios or test equipment p>The Mullard ECC82 has such curves for 50V 100V 150V 200V 250V and 300V and yet it is often only used as a phase splitter with high Va
The Mullard ECC81 has curves for 100V 170V 200V and 250V and similar for use as a radio frequency oscillator or mixer but it's my go to for many audio applications
The E88CC or ECC88 data is specified at 90V so that is where every one quotes it must be used but it is a maximum Va and you may find that it works better at a lower anode voltage and current as a cascode amplifier
![]()


" Darling if you only knew ~ Half as much as everybody thinks you do "